
Implemented Simulation · Learning Project

Notion Digital Growth Operations System

Connected databases, rollups and linked views in one system for organizing everyday work.

Project context

A connected operating system for a digital team

The Digital Growth Operations Hub is a self-directed Notion learning project simulating the day-to-day operations of a small digital agency or marketing department. It brings clients, projects, tasks, ownership and reusable guidance into one connected workspace.

The demo contains two fictional clients, three active projects, four defined roles and a focused set of tasks and playbooks. It demonstrates information architecture and operational logic, not real client delivery or business performance.

View the published Notion system ↗

Opens the published, view-only Notion site in a new tab.

The challenge

One source of truth, without unnecessary complexity

  • Create one source of truth without repeating client, project or owner information across pages.
  • Make project progress visible without opening and counting every task manually.
  • Give managers a useful overview while preserving the detail each team member needs.
  • Connect reusable playbooks to active work so knowledge supports execution.
  • Keep the demo lean enough to explain in five to ten minutes.

Objective

Build an understandable, expandable operations system for Google Ads, Meta Ads, analytics, Google Tag Manager, CRM and sales workstreams. Success meant connected databases, clear ownership, automatic progress indicators and practical dashboard views—without unnecessary records or invented results.
My contribution

From use case to reviewable implementation

Defined the use case, lean demo scope and success criteria.

Designed the five-database information architecture.

Created database properties, relations and rollups.

Built linked dashboard views for the portfolio, active tasks and knowledge.

Added fictional clients, projects, roles, tasks and playbooks to test the workflows.

Configured board, table, timeline and gallery views for different operating needs.

Published a view-only Notion site for direct review.

System architecture

Five master databases. One management view.

CLIENTS

Business context

Stores fictional organizations and connects each to its projects.

PROJECTS

Delivery portfolio

Connects client, owner, status, priority, dates and tasks. A rollup calculates project progress.

TASKS

Execution layer

Connects each task to its project, assignee and playbook, alongside status and due date.

TEAM

Ownership model

Links demo roles to the projects they own and tasks assigned to them.

KNOWLEDGE BASE

Reusable guidance

Holds playbooks, checklists and QA guides linked to the tasks they support.

OPERATIONS DASHBOARD

Management view

Surfaces linked views of projects, active tasks and knowledge without duplicating records.

Relations and rollups in practice

Connected records. Useful information.

01

Relations connect records

A Relation links records across databases. Clients connect to Projects; Projects to Tasks and Project Owners; Tasks to Assignees and Related Playbooks.

02

Rollups use those connections

A Rollup retrieves or calculates information through a Relation, turning connected records into useful information without re-entering data.

03

Project Progress updates automatically

The Projects database rolls up related Task statuses and calculates the percentage in the Complete group. Managers can see progress from the portfolio view without checking each task.

04

Task Client inherits context

A task links to its Project; a rollup surfaces that Project’s Client. This avoids entering the client twice and reduces inconsistent records.

Views and workflow

The same information, organized for each need

Project Portfolio board: groups projects by status, prioritizing important work and approaching deadlines.

Project Timeline: uses start and due dates to show the delivery sequence.

Active Tasks: focuses attention on current work rather than the full task database.

Knowledge Library gallery: makes reusable guidance easier to browse by category and title.

Library content: playbooks for keyword research, search campaign QA, measurement and tag QA, Meta creative testing and lead qualification.

Visual evidence

The system map

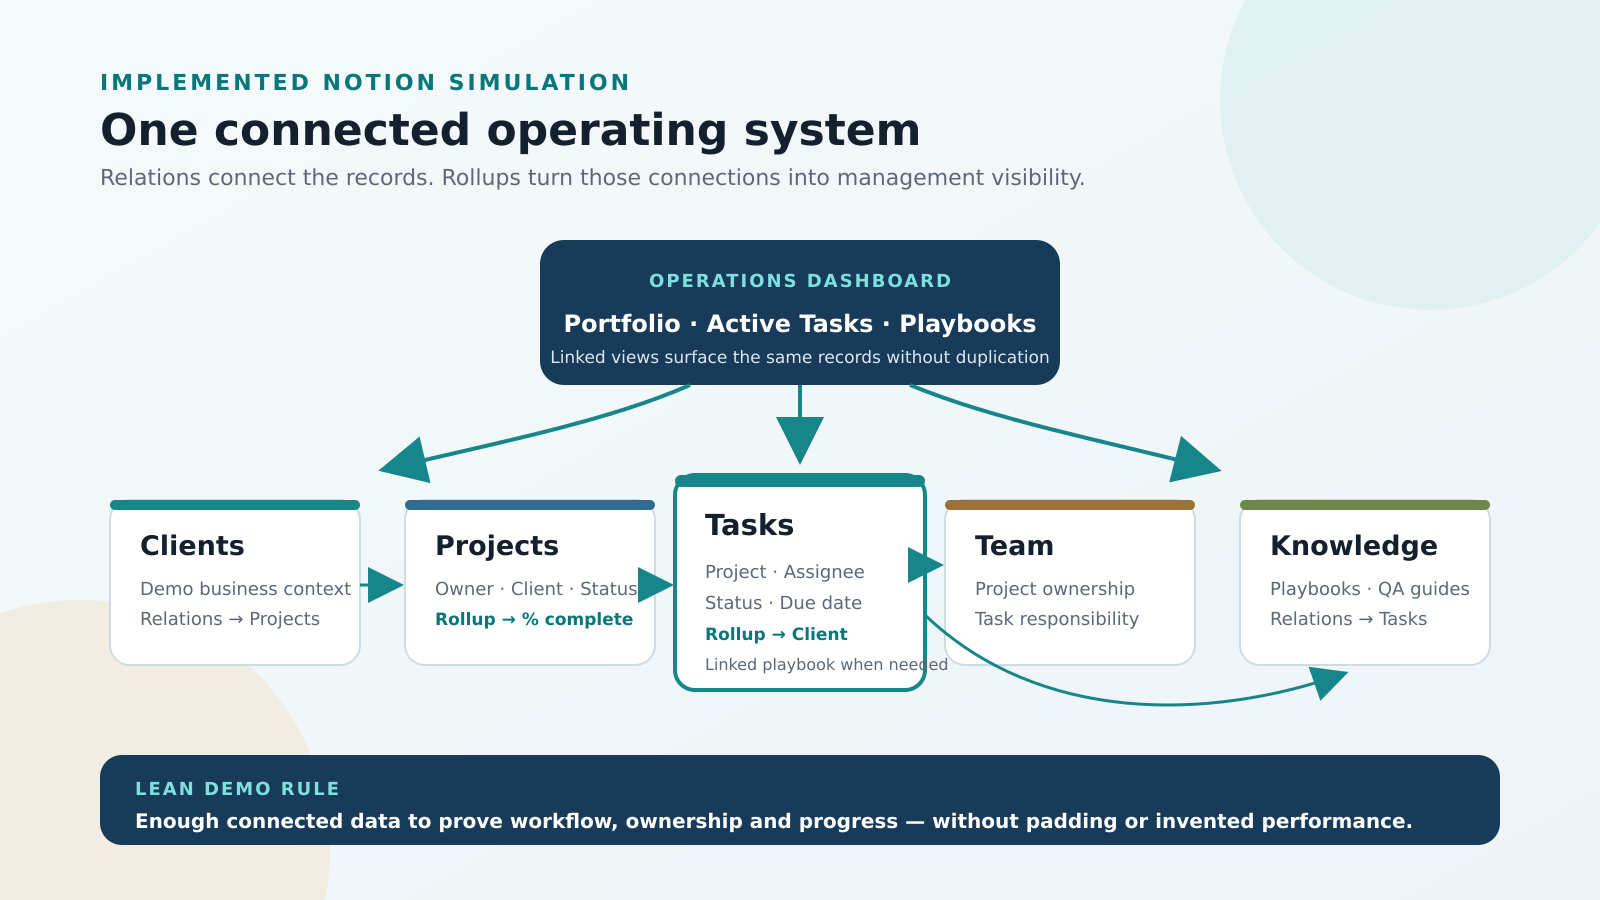
The map connects the five core databases to the Operations Dashboard. Relations link records, rollups surface useful information and linked views put it where it is needed—without duplicate entries.

Notion system map with five linked databases, dashboard views and two practical rollups

System map: five master databases, linked dashboard views and two practical rollups create management visibility without duplicate records.

Outcome

A functioning, published demonstration

A working Notion demo that can be explored directly. It shows how a lean operations hub connects business context, delivery, ownership and knowledge, giving managers a clearer view of priorities and progress.

The public demo documents the system’s architecture, connections and operating logic. It is a learning project, so no real agency operations, client results or productivity improvements are claimed.

Limitations and disclosure

Clear evidence. Disciplined claims.

  • An implemented learning project, not a production client workspace.
  • Clients and additional team members are fictional demo records.
  • No live advertising data, finance, invoicing, automation platform or complex employee system is included.
  • No revenue, campaign-performance, time-saving or operational-efficiency claim is made.

What this project demonstrates

Skills made visible through the system

Operations-system designNotion database architectureRelations and rollupsLinked database viewsProject and task workflowsOwnership and responsibility mappingKnowledge-base and playbook designDashboard and portfolio viewsLean demo constructionEvidence and claim discipline

Published implementation

Explore the connected Notion hub

Open the Notion hub ↗